Forecast the stock market trends - my secret techniques
SIMPLY SHOCKING and SHOCKINGLY SIMPLE and easy way to forecast the stock market trends.
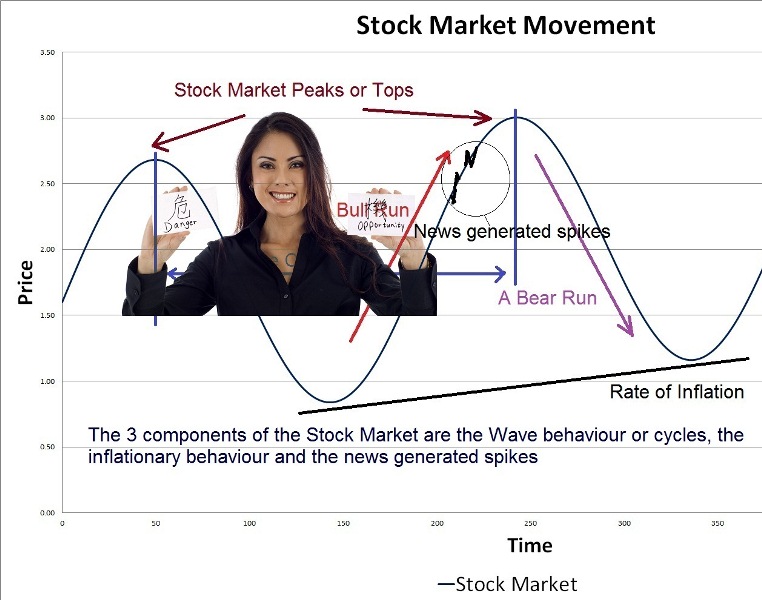
That chart above shows my theory of stock markets and commodity trends that I use to forecast the stock market. This simple idea is so powerful that I have been using it since 1998 to predict Bull Runs. Now I am releasing my secret techniques so that you too can do your own stock market analysis to forecast the stock market and commodity trends.
The simplest idea of all to forecast the stock market
The simplest idea of all, to forecast the stock market, that has been overlooked by economist and investment analyst all over the world is that economies oscillate. There is a rhythm to the markets which is mistakenly called business cycles because business cycles are simplistic movements but rhythms have connotations of more complex phenomena, just like melodies and orchestrated symphonies. Anyone looking at the chart above, even if it was incomplete would be able to tell where the market tops and market bottoms are, right? Try if for yourself, cover part of the chart with a paper and see if you can pin point approximately where the next market top and bottom will be. Can you forecast the stock market movement?
Easy wasn't it? Take caution in that not all stocks have such a simple price trend curve but you will be amazed how many do. Even in commodities you find the similar patterns. The most import understanding in order to forecast the stock market is to know the rhythm of the market. There are several basic types of movements mentioned in my book.
Why no one figured out how to forecast the stock market trends?
I tell you another thing, no one noticed the rhythms, the oscillations or the cycles and that is why no one figured out how to forecast the stock market. The big fund managers have put in millions of dollars into researching this problem and had failed. Academics have researched this topic on predicting the stock market and come out with nothing.Many tried Quantum Mechanics, Artificial Intelligence, Statistical Methods,... you name it, it failed to forecast the stock market trends as they were using the wrong techniques.
What do you think a commodity and stock market analysis technology like this is worth? $1,000,000?, ... $10,000,000? How much would you pay to get your hands on the most powerful analyses techniques ever invented that could in a matter of minutes allow you to forecast the stock market just by visual inspection?
Why many tried and many failed at forecasting the stock market?
Why did many analyst fail to see this phenomena and fail to predict the stock market? Almost everyone has been looking at yesterday's and today's data. It takes years of data to see this pattern. If economist and analyst had been looking at 12 years of data or more, they too would have seen it and would have been able to predict or forecast the stock market. And no one came up with a mathematical theory to forecast the stock market.
Awarded a Doctorate in Economics for my techniques on stock market analysis
I had spent 18 years to put the pieces together for commodity trend analysis and stock market analysis and accidentally created an alternative theory of economics to forecast the stock market trends. The Americans were so impressed by my theories that they awarded me a Doctorate in Economics for my mathematical models to forecast the stock market trends, commodity trends, consumer markets and many new theories in Economics and Mathematics.
Now I have simplified my system of prediction and am literately giving away valuable stock market forecasting techniques secrets for almost free! If you need to view some of my predictions done in 2012 please refer to 2012 predictions with more advanced technolgy and the Gold and NYSE explanation
Oh, by the way did you hear of the term 'Real Economy' used by many economist around the world? I coined that term during the Asian Financial Crisis of 1997.
Are market tops and bottoms important stock market trends?
Is knowing when the market will peak and when it will bottom, important to you?
It is important to know when the market bottoms and when they peak, to be able to forecast the stock market trends. This is the most fundamental of all stock market analyses before you can proceed further to predict or forecast the stock market. Unfortunately, almost no one practices this from of stock market analysis because they cannot to do it. They cannot forecast the stock market.
This aspect, predicting the market tops and bottoms, is extremely important for two reasons.
Firstly, you don't want to be the last guy to buy a share at the top of the market and find that the share prices collapses on you after that.
Secondly, you don't want to miss very low cost investment opportunities at the bottom. Did you buy some Citibank shares in 2009? They were at a dirt cheap price of $1 or less per share. If you had invested then, the rewards today, for sitting and waiting and doing nothing, are huge. As of April 2012, almost exactly 3 years later, they are worth about $36 per share. That is at least 3600% return on investment or like 1200% return on invest per year ... for doing nothing. Even your bank cannot give you those types of returns. Did your stock market analysis show March 2009 was the stock market bottom?
This is the most powerful technique you will ever come across that is to be able to forecast the stock market bottom. Don't believe those who say that you cannot forecast the stock market bottom. They do not know what they are talking about and they have never succeeded at predicting the stock market bottom because they do not know anything about my theory of markets.
With this downloadable book I will show you how to forecast stock market tops and stock market bottoms.
The 9 secrets for forecasting the stock markets
A prerequisite to stock market analysis is understanding your financial situation. You must know where you are coming from and going to before you do any stock market analysis. What is your ability to take risk? How much risk can you take or rather what is your maximum exposure? The World Recession of 2008 was severe because the American and European banks did not understand the concept of over exposure. You do not want to get into such a position when you do your stock market analysis, right?
I will show you the 9 secrets that I use as part of my stock market analysis to forecast the stock market, any stock market. I will introduce you to some important topics before you begin to trade and begin to forecast the stock market movement. They are:-
1. Estimating Stock Market Tops and Bottoms
That is right, in this PDF format e-book, I will show you how to determine when the next market top or bottom will be and the approximate value. This is the most important technique you will ever need to know. Every other technique, whether American Bar Chart, Japanese Candlestick, Stochastics,... is secondary. The book explains that economies and markets are in constant oscillation and hence it is possible to forecast when the stock market, any stock market in the world, would peak and when it would bottom out. I show several simple techniques, which can be used by visual inspection, at a glance, to determine when the next market top and market bottom will occur. Isn't that simple? These techniques are good for beginners and experts.
2. Risk and Exposure
I will show you how to approximately determine the risk you are taking when you buy stocks. Furthermore, I will show you, briefly, how to limit you financial situation so that you do not go bust if your trade goes wrong. These are very important topics that every investor, day trader or speculator must understand before they step into the market. This is a must for everyone to understand before they try to forecast the stock market or even trade as a speculator, day trader or investor. Very few courses will teach you these techniques because their concept of risk is very different form mine even though they use the same or similar definition to mine. Simply put, they do not comprehend the concept of exposure or rather over exposure.
3. Unique Cut loss position system
I have devised very simple and easily understood technique to implement 'Cut Loss' position. An important topic not covered by many books and courses is how to determine one's cut loss position. This is the point at which one needs to get out of the stock market if the market is unprofitable. The techniques are so simple that you can determine your cut loss position by visual inspection, at a glance, in your stock market analysis. The cut-loss positioning technique I describe in this e-book is unique to my theory.
4. Avoid invalid stock market analysis techniques to forecast the stock market
I will show you in my downloadable e-book that there are some types of stock market analysis techniques that are invalid and cannot be used for any form of trading or to forecast stock market trends.
5. Unbelievably Simple techniques to forecast the stock market
Until you read my downloadable book you will not realise how simple it is to do your own stock market analysis to forecast the stock market tops and bottoms. I have been using these techniques in the 1998 Asian Financial Crisis. During the 1998 Asian Financial Crisis I predicted the Bull Run of September 1998. The techniques described are my original works and are not available from other authors. They are the results of 18 years of research and are unique as they are a direct result of my Alternative Theory of Economics.
| SIMPLY SHOCKING and SHOCKINGLY SIMPLE, my secret techniques to forecast the stock market trends for only US$ 19.90. | |
|